Financial Metrics Beyond CapEx and OpEx: A CTO’s Essential Guide

For CTOs, CIOs, and technology leaders, mastering the financial language of the business is crucial. This fluency not only empowers informed decision-making but also ensures you communicate effectively with executive peers, investors, and board members. While CapEx (Capital Expenditures) and OpEx (Operational Expenditures) are commonly discussed, technology leaders must understand additional financial metrics to truly drive business success.

Key Financial Metrics Technology Leaders Should Know:

1. Gross Margin (GM%)

  • Definition: Revenue minus the cost of goods sold (COGS), expressed as a percentage.
  • Example: A SaaS company generates $10M in revenue with $4M in direct technology and hosting costs, yielding a GM% of 60%.
  • Importance: Indicates efficiency in service delivery and informs pricing strategies.
  • Tech Link: Optimize infrastructure efficiency to boost GM%. Technology improvements such as automation and efficient architecture reduce direct costs. Regularly report these efficiency gains to demonstrate impact.
  • Further Reading

2. Earnings Before Interest, Taxes, Depreciation, and Amortization (EBITDA)

  • Definition: A measure of a company’s overall financial performance and profitability.
  • Example: Investing in automation reduces manual labor, improving EBITDA by lowering operating expenses.
  • Importance: Frequently used by investors, especially in Private Equity.
  • Tech Link: Automation and efficiency projects directly improve EBITDA. Clearly document savings and incremental EBITDA impact in regular reports.
  • Further Reading

3. Annual Recurring Revenue (ARR)

  • Definition: Predictable annual revenue from subscription-based services.
  • Example: A SaaS company with 100 customers each paying $10,000 annually has an ARR of $1M.
  • Importance: Provides predictability of revenue, crucial for growth forecasting.
  • Tech Link: Technology enhancements that improve customer retention directly boost ARR. Report on retention and churn metrics linked to technology improvements.
  • Further Reading

4. Monthly Recurring Revenue (MRR)

  • Definition: Predictable monthly revenue from subscription-based services.
  • Example: 500 customers each paying $100 monthly equals $50,000 MRR.
  • Importance: Vital for short-term forecasting and agile business adjustments.
  • Tech Link: Regular technology updates that enhance user experience help maintain and increase MRR. Report monthly changes linked to technology deployments.
  • Further Reading

5. Annual Contract Value (ACV)

  • Definition: The average annual revenue per customer contract.
  • Example: A new enterprise client signs a 3-year deal worth $600,000, resulting in an ACV of $200,000.
  • Importance: Helps measure and forecast revenue stability and client value.
  • Tech Link: Tech solutions that enable upselling and increased client value directly impact ACV. Regularly track and report ACV impacts from feature enhancements.
  • Further Reading

6. Customer Lifetime Value (LTV)

  • Definition: Total revenue a company expects from a single customer over time.
  • Example: Improving platform usability to extend customer retention boosts LTV.
  • Importance: Demonstrates long-term customer profitability.
  • Tech Link: Measure and report the impact of technology on extending customer retention and revenue per user.
  • Further Reading

7. Burn Rate

  • Definition: Rate at which a company uses cash, typically in startups.
  • Example: A startup spending $200K monthly with $1M cash on hand has a 5-month runway.
  • Importance: Crucial for managing funding and operational sustainability.
  • Tech Link: Technology efficiency and cost management directly reduce burn rate. Regularly monitor and report cost-saving initiatives and their impact on burn rate.
  • Further Reading

8. Return on Investment (ROI)

  • Definition: Measures profitability of an investment.
  • Example: Cloud migration yielding $500K annual savings from a $1M investment offers a 50% annual ROI.
  • Importance: Validates technology spending by demonstrating financial returns.
  • Tech Link: Frame and track technology investments clearly in ROI terms.
  • Further Reading

9. Compound Annual Growth Rate (CAGR)

  • Definition: Annualized average rate of revenue growth over a specific period.
  • Example: Growth from $1M to $4M over four years represents a CAGR of approximately 41%.
  • Importance: Indicates business scalability and growth trajectory.
  • Tech Link: Report how product enhancements and scalability directly impact CAGR.
  • Further Reading

Considerations for Private Equity (PE) -backed Companies:

PE firms prioritize efficiency, EBITDA, and rapid ROI. Focus on clear cost reduction, operational efficiency, and short payback periods, demonstrating immediate and measurable technology impacts.

Considerations for Venture Capital (VC)-backed Companies:

VC-backed companies emphasize ARR, MRR, growth metrics like CAC and LTV, and burn rate management. Clearly demonstrate technology’s role in accelerating growth, enhancing customer retention, and controlling burn rate.

Considerations for Public Companies:

Public companies prioritize consistent revenue growth, profitability, regulatory compliance, and transparency. Technology leaders must focus on clear reporting, compliance measures, and technology-driven growth that aligns with shareholder interests.

Considerations for Privately Held Companies:

Privately held firms value long-term stability, sustainable growth, cash flow, and cost control. Technology initiatives must emphasize predictable financial outcomes, stability, and prudent investments.

Summary

Understanding and demonstrating your contribution to financial metrics beyond CapEx and OpEx empowers technology leaders to drive impactful decisions, communicate clearly with stakeholders, and align technology strategies with business objectives. Your fluency in these metrics enhances your value as a strategic business leader.

#CTO #CIO #CPO #FinancialMetrics #ProductStrategy

Why Technical Priorities Consistently Get Pushed Aside Without Clear Business Value?

There’s a tough reality facing engineering teams everywhere: technical priorities consistently get pushed aside when they aren’t clearly linked to business value. We see this pattern again and again. Teams raise concerns about technical debt, system architecture, or code quality, only to have those concerns deprioritized in favor of visible business initiatives.

The problem isn’t a lack of understanding from leadership or CTOs. Instead, the real challenge lies in how we communicate the importance of technical work. When the business impact isn’t clear, technical projects become easy to delay or ignore, even when they are critical for long-term success.

To shift this dynamic, technologists need to translate technical needs into measurable business outcomes. Only then do our priorities get the attention and investment they deserve.

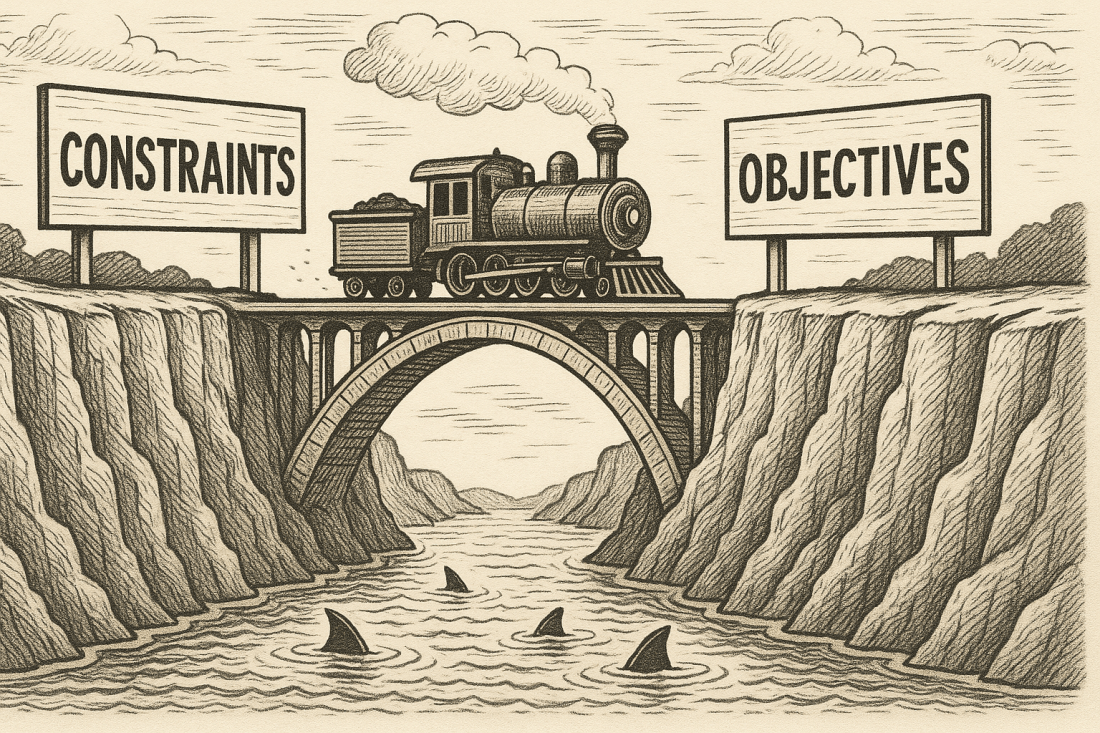
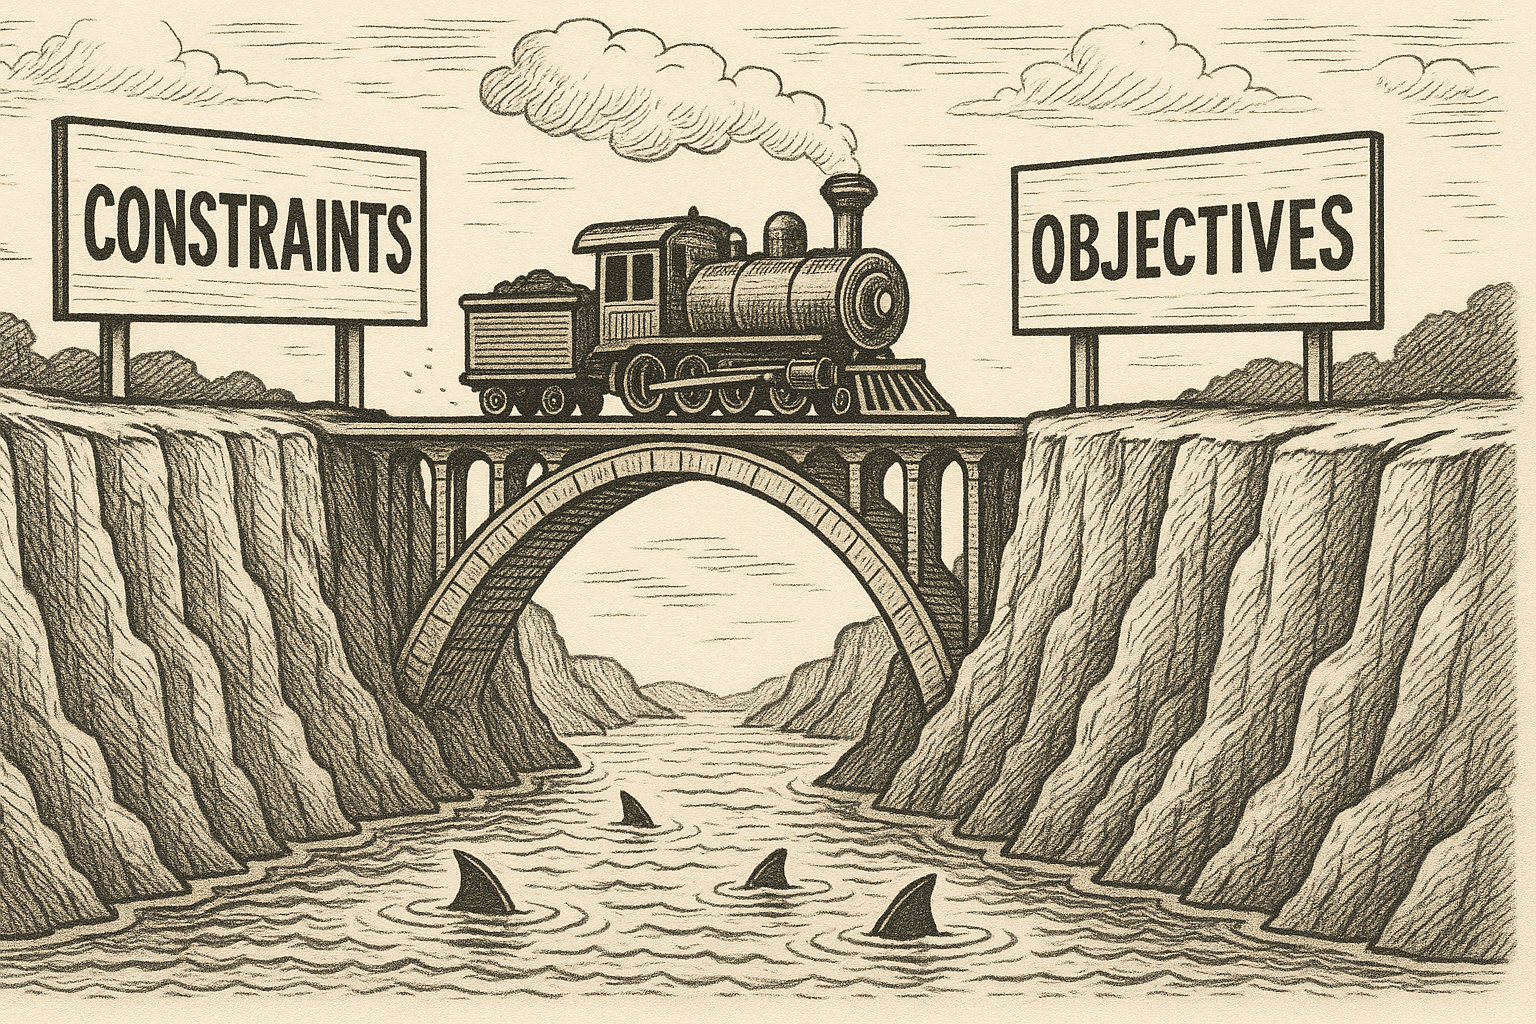
The Real Challenge: Bridging the Business-Technology Divide

Too often, technical teams speak their own language. We say, “We need better observability,” and leadership hears, “More dashboards for tech’s sake.” We argue for automated testing, and management hears, “You want to slow us down.” The disconnect is clear. Technical needs get ignored unless we connect them to measurable business outcomes.

This isn’t just anecdotal. Charity Majors, CTO at Honeycomb, puts it simply:
“If you can’t connect your work to business value, you’re not going to get buy-in.”

Similarly, The Pragmatic Engineer notes that the most effective engineers are those who translate technical decisions into business impact.

Reframing Technical Work: From Features to Business Outcomes

Technical excellence is not an end in itself. It is a lever for achieving business goals. The key is to frame our technical priorities in language that resonates with business leaders. Here are some examples:

  • Observability:
    • Tech speak: “We need better observability.”
    • Business outcome: “Our customers reported outages. Enhanced observability helps us detect and fix issues before clients are impacted, cutting response time in half.”
  • Automated Testing:
    • Tech speak: “Let’s add more automated tests.”
    • Business outcome: “Recent critical bugs delayed product launches. Automated testing helps us catch issues earlier, so we deliver on time.”
  • Infrastructure as Code:
    • Tech speak: “We should automate infrastructure.”
    • Business outcome: “Manual setup takes days. With infrastructure as code, we can onboard new clients in minutes, using fewer resources.”

Supporting Reference:
Accelerate: The Science of Lean Software and DevOps shows that elite engineering teams connect technical practices such as automation and observability directly to improved business performance, faster deployments, fewer failures, and happier customers.

The Business Value of Code Quality

When we talk about refactoring, testing, or reducing technical debt, we must quantify the benefits in business terms:

  • Faster time-to-market: Better code quality and automation mean quicker releases, leading to competitive advantage. (Martin Fowler on Refactoring)
  • Lower support costs: Reliable systems and early bug detection lead to fewer incidents and reduced customer complaints. (InfoQ on Technical Debt)
  • Employee efficiency: Automating manual tasks lets teams focus on innovation, not firefighting.

Google’s DORA research (State of DevOps Report) consistently shows that organizations aligning technical practices with business goals outperform their peers.

Actionable Takeaways: How to Make Technical Work Matter

  1. Speak in Outcomes:
    Always explain how technical decisions impact revenue, customer satisfaction, or risk.
  2. Quantify the Impact:
    Use metrics. For example, “This change will save X hours per month,” or, “This will reduce client onboarding from days to minutes.”
  3. Connect to Business Goals:
    Align your technical arguments with the company’s strategic priorities such as growth, retention, efficiency, or compliance.
  4. Reference External Proof:
    Bring in supporting research and case studies to back up your proposals. (ThoughtWorks: The Business Value of DevOps)

Summary

The most influential engineers and technologists are those who relentlessly tie their work to business outcomes. Technical excellence is a business multiplier, not a checkbox. The real challenge is ensuring every technical priority is translated into language that leadership understands and values.

The question we should all ask:
How are we connecting our technical decisions to measurable business results?

Further Reading


#EngineeringLeadership #CTO #CIO #ProductStrategy

Brand vs. Price: What Product Managers Need to Understand

In product management, we often obsess over features, user stories, and roadmaps. But the most strategic conversations often center around two deceptively simple questions: How much should we charge? and What do people think we’re worth? These two questions cut to the heart of the relationship between brand and price, a relationship every product leader must learn to navigate.

Brand and Price Are Not Separate Tracks

Too often, brand is viewed as a marketing function and price as a finance lever. But in reality, they are deeply interconnected. Your brand defines perceived value, and your price captures it.

If your product is seen as premium, strategic, or mission-critical, you can justify higher pricing, lower churn, and even slower delivery cycles. If your brand is weak or undifferentiated, you may find yourself in a race to the bottom, competing primarily on features and discounts.

How Brand Impacts Product Strategy

A strong brand gives product managers room to:

  • Delay commoditization. Apple’s iPhone rarely leads in specs but consistently leads in margins.
  • Build for long-term value. Atlassian’s success came from building utility over time, not hype at launch.
  • Design pricing tiers around perceived value. Notion and Figma used design and UX to justify professional pricing, even with freemium entry points.

How Pricing Shapes Brand Perception

Pricing is not just a revenue tactic. It is also a clear statement of positioning.

  • Zoom vs. Google Meet. Zoom priced higher and leaned into reliability and enterprise readiness. Meet was bundled into G Suite, signaling simplicity and convenience.
  • Airtable vs. Excel. Airtable’s polished experience and higher per-seat cost suggest modernity and innovation, compared to Excel’s utilitarian legacy.

Low pricing can diminish perceived value. Overpricing without strong brand signals can drive away potential customers. Product teams must ensure that pricing reflects strategic intent, not just cost or competitor benchmarks.

A Framework for Brand and Price Alignment

To align brand and price through product decisions, ask yourself:

  1. What does our target market value most: price, prestige, reliability, or speed?
  2. Does our current roadmap reinforce our brand promise or contradict it?
  3. Are we bundling and pricing in ways that strengthen our market position?
  4. How does our pricing compare to our competitors, and what does that say about us?

Examples in Action:

  • Slack offers free team versions and usage-based pricing, reinforcing its identity as a friendly, accessible work tool.
  • Salesforce embraces premium and complex pricing that reinforces its reputation as the enterprise standard.
  • Linear maintains a minimalist, premium feel by carefully curating its features and emphasizing speed over bloat.

The Role of Growth Teams

Growth teams act as the connective tissue between product, marketing, and revenue. They provide valuable insights into how users perceive brand and respond to pricing.

  • Conversion data highlights where perceived value breaks down. If users drop off at the paywall, the issue may be the mismatch between expectation and price.
  • Pricing experiments validate assumptions. Growth teams can test package structures and feature gates to learn what resonates.
  • Brand-led growth loops, like Superhuman’s invite-only onboarding or Notion’s template ecosystem, build perceived value without discounting.

In many cases, growth teams help product managers answer the hardest question: Do people value what we’ve built enough to pay for it?

Final Thought

Brand and price are not just marketing or finance concerns. They are fundamental to how your product is designed, delivered, and perceived. Every roadmap decision and packaging choice shapes how customers see your value.

Great product leaders do more than ship features. They shape perception, define value, and build trust through intentional design and strategic pricing.

#ProductStrategy #CPO #CTO #CIO

Bridging Constraints and Objectives with Data in Product Launches

Launching a new product means navigating tension: bold objectives on one side, and real-world constraints on the other. You want to move fast, deliver value, and stand out in the market, but you’re held back by resource limits, compliance requirements, and fixed deadlines. The difference between vision and execution? It’s often how well you use data to connect the two.

Why Data is the Bridge

Data enables product leaders to:

  • Quantify what’s possible within given limits
  • Align stakeholders on the tradeoffs that matter
  • Validate market assumptions before committing to scale
  • Convert ambiguity into informed action

Used well, data doesn’t just guide, you de-risk your decisions with it.

1. Use Data to Define the Real Constraints

Most teams understand their high-level constraints: budget, time, people. But data can help you go deeper and quantify the impact of those constraints.

  • Burn rate models estimate how far your current budget takes you.
  • Headcount capacity planning identifies delivery bottlenecks.
  • Compliance risk scoring can uncover which features require the most red tape.

Then, tie constraints to revenue impact:

  • Revenue impact modeling shows what features or launches are delayed and how that delay affects potential earnings.
  • For example, if a delayed feature defers onboarding 1,000 users per month at a $50 average revenue/user, you can quantify that tradeoff: $50,000/month in deferred revenue.

Action tip: Frame constraint discussions around their revenue implications to drive smarter tradeoffs.

2. Translate Objectives into Measurable Signals

Ambitious goals like “win the mid-market” or “increase retention” need clear, data-backed definitions:

  • Use market sizing data to break down total addressable market (TAM), serviceable obtainable market (SOM), and key buyer personas.
  • Map strategic goals (e.g., “expand to EMEA”) to product KPIs (e.g., time-to-localization, conversion rates by region).
  • Use customer segmentation data to align objectives with where the most revenue or growth potential exists.

Action tip: Create a “data-to-objective map” that connects strategic goals to specific, quantifiable signals in your product analytics.

3. Use Data to Understand Market Fit Early

Product success hinges on whether it meets a real market need, and whether that market is worth entering.

  • Search trends, competitor pricing, and customer spend data can help validate demand before investing.
  • Use tools like Google Trends, LinkedIn job postings, or firmographic data to identify which markets are growing or underserved.
  • Analyze customer willingness-to-pay surveys and early funnel data (e.g., demo conversion rates) to refine positioning.

Action tip: Layer third-party data with internal early signals to triangulate real market opportunity before full launch.

4. Apply Data to Prioritize Tradeoffs Transparently

Every product decision requires a tradeoff. But data helps you make those tradeoffs visible, quantifiable, and less political.

  • Run feature impact simulations to model revenue uplift vs development time.
  • Use churn data to highlight which constraints (e.g., lack of functionality, latency, onboarding friction) are losing you customers.
  • Score roadmap options by business value per unit of effort to prioritize efficiently.

Action tip: Build a tradeoff matrix that pairs data with decision velocity, so leadership can move with confidence, not caution.

5. Align Stakeholders with Shared Data Visibility

Cross-functional stakeholders often have competing priorities. Data helps unify focus around outcomes, not opinions.

  • Build shared dashboards that track both constraint metrics (e.g., spend, velocity) and objective metrics (e.g., adoption, revenue).
  • Use visual storytelling to show the downstream effects of decisions, such as how one-month delays reduce first-year revenue projections by X%.

Action tip: Establish a shared “north star” metric that links product, revenue, and operational perspectives.

6. Use Feedback Loops to Navigate Uncertainty

Post-launch, data is your compass. Assumptions will shift, and your ability to adapt fast will determine your success.

  • Monitor early adoption and feature usage data to refine roadmap priorities.
  • Use voice of customer data to catch friction points before churn accelerates.
  • Track changes in market or competitor data to stay ahead of disruption.

Action tip: Treat every launch like an ongoing experiment, use data to validate, not just to report.

Thoughts

Taking a product to market is a balancing act. The most successful leaders aren’t just bold, they’re informed. They use data to quantify the real constraints, validate the market opportunity, and continuously weigh tradeoffs against business value.

If you want to move faster, align better, and launch smarter, ask yourself: Where can data help me bridge the gap between what I want to do and what I actually can do?

#ProductStrategy #CTO #CPO #CIO

Forward-Deployed Engineers: The Secret Ingredient to a Modern Technology Strategy

In the race to build adaptive, customer-centric technology organizations, few strategies are as transformative as embedding forward-deployed engineers (FDEs) at the heart of your operating model. Companies delivering both products and services increasingly recognize that FDEs can be the critical element for innovation, client satisfaction, and sustainable growth.

What Is a Forward-Deployed Engineer?

A forward-deployed engineer is a technically skilled, client-facing engineer who operates at the intersection of engineering, product, and business teams. FDEs immerse themselves with customers and stakeholders, translating real-world challenges into actionable solutions and continuous product improvement.

Why FDEs Matter in a Modern Technology Strategy

Modern technology strategies depend on rapid learning, customer intimacy, and agile iteration. Traditional product engineering, often insulated from customers, can lag behind shifting market needs. FDEs bridge this gap by:

  • Surfacing Urgent Needs: They capture direct insights from customer environments, reducing the risk of isolated development.
  • Accelerating Solution Delivery: FDEs rapidly prototype and deliver customized integrations, ensuring products and services remain relevant.
  • Driving Product Evolution: Their field experience becomes direct input for product management, aligning investments with actual market requirements.

Real-World Examples

Palantir: Palantir built its global reputation around the FDE model. Their engineers deploy on-site with clients, delivering custom data solutions and feeding requirements back to product teams. This approach allowed Palantir to quickly address complex, high-value use cases competitors struggled to solve.

Stripe: Stripe’s “solutions engineers” blend technical acumen with customer empathy. Their collaboration with enterprise clients enables successful integrations and tailored solutions, significantly contributing to Stripe’s ability to move upmarket.

Google Cloud: Google Cloud’s customer engineers act as field-based technical experts. They architect solutions and relay critical feedback from clients, giving Google Cloud strategic leverage in the competitive enterprise technology landscape.

Who Makes a Great FDE?

FDEs represent a rare combination of skills:

  • Technical Depth: Strong software engineering or systems engineering experience, often equivalent to core engineering staff.
  • Business Acumen: Able to quickly grasp domain-specific business problems and communicate effectively with stakeholders.
  • Exceptional Communicators: Skilled in explaining complex technical concepts to clients, business teams, and internal engineering groups.
  • Adaptable Problem Solvers: Comfortable working in ambiguous environments and across multiple teams or client settings.

Ideal candidates frequently have backgrounds in consulting, solutions architecture, or roles that have required balancing technical expertise with customer-facing responsibilities. Emotional intelligence and curiosity are equally critical.

How FDE Recruiting Is Different

Recruiting forward-deployed engineers requires a specialized approach:

  • Focus on Communication: Interviews often include scenario-based exercises involving both technical and non-technical stakeholders.
  • Broader Skills Assessment: Beyond coding skills, candidates might run workshops, present technical solutions, or engage in simulated client interactions.
  • Values and Mindset: Recruiters emphasize a growth mindset, adaptability, and empathy, qualities less central in traditional engineering hiring processes.
  • Diverse Backgrounds: Recruitment often draws from non-traditional engineering paths, such as consulting, customer success, or technical sales roles.

Pro Tip: The most successful FDEs typically have career experiences involving multiple roles and thrive when presented with ambiguous challenges.

Career Paths for FDEs

The FDE role offers distinct career paths:

  • Leadership in Product or Engineering: Many FDEs advance into product management, technical program management, or senior engineering leadership roles, leveraging their broad client experience.
  • Specialist or Principal FDE: Some become field CTOs or principal field engineers, shaping client outcomes and internal engineering strategies.
  • Core Engineering Roles: Others return to core product development, enhancing team effectiveness with their direct client perspectives.

Forward-thinking organizations formalize the FDE career ladder with clear recognition, training opportunities, and advancement paths reflecting the significant business impact these individuals generate.

The Counterpoint: Risks and Tradeoffs

While powerful, the FDE model also introduces risks:

  • Resource Allocation Challenges: Assigning top engineers to client sites can diminish resources available for core product development.
  • Role Clarity Issues: Without clear definitions, FDEs might focus too heavily on custom solutions, negatively affecting scalability and product focus.
  • Burnout Potential: The demands of frequent client engagements and extensive travel can lead to retention and morale issues.

Some companies have found that, without disciplined feedback loops and defined boundaries, the FDE role can inadvertently lead to overly customized, unsustainable client solutions.

How to Succeed with FDEs

Organizations successful with FDE implementation use disciplined approaches:

  • Tight Feedback Loops: Establish clear communication channels between FDEs and product or engineering leadership to ensure client insights shape product roadmaps.
  • Rotation and Growth: Create rotational opportunities between field and core teams, maximizing knowledge sharing and preventing burnout.
  • Clear Mission and Boundaries: Clearly define responsibilities to focus FDE efforts on scalable, broadly beneficial solutions rather than overly bespoke work.

Conclusion

As companies strive to become more agile, responsive, and deeply attuned to customer needs, forward-deployed engineers have become an essential element in a modern technology strategy. The FDE model ensures alignment between real-world client requirements and product evolution, promoting growth and resilience. Achieving this value requires careful talent selection, targeted recruitment, and intentional organizational support.

References:


#DigitalTransformation #CTO #CIO #ProductStrategy #EngineeringLeadership #FutureOfWork