Somewhere between the thunderclaps of innovation and the quiet hum of data centers, a strange chill fills the air. It’s not the wind. It’s not the ghosts. It’s the sound of AI adoption still accelerating long after everyone thought it might slow down.
Because if there’s one thing scarier than a monster rising from the lab,
it’s realizing it’s still growing.
⚡ The Laboratory of Limitless Growth
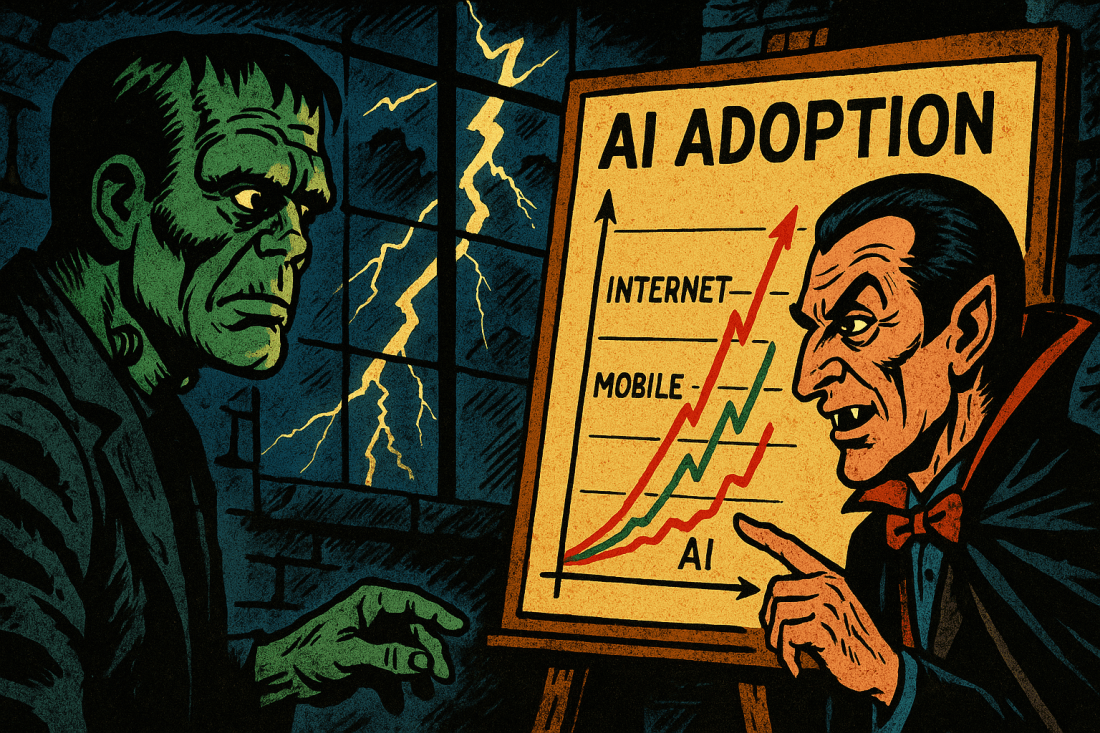
Deep inside a candlelit castle, lightning flashes across the stone walls. Test tubes bubble with neural networks, and electricity hums through old copper wires. At the center of it all, Frankenstein’s monster stands hunched over a chalkboard.
On it are three jagged lines, one for the Internet, one for Mobile, and one, glowing ominously in neon green, for AI.
Dr. Frankenstein peers at the data through cracked goggles.
“Impossible,” he mutters, flipping through a pile of parchment labeled St. Louis Fed and eMarketer. “Every curve must flatten eventually. Even the mobile revolution reached a plateau.”
The monster turns, bolts sparking from his neck. “But master,” he says in a low rumble, “the curve… it’s still rising.”
📈 The Data Doesn’t Die
The Count appears in the doorway, cape sweeping dramatically behind him.
Dracula, the eternal observer of technological transformation, carries a tablet glowing with eerie blue light.
“Ah, my dear doctor,” he says, “you’re still studying your creature? You forget, I’ve watched centuries of human obsession. Printing presses, telegraphs, the telephone, the internet. Each one rose, and then rested.”
He smirks, his fangs catching the candlelight.
“But this new creation, this Artificial Intelligence, it refuses to sleep.”
Frankenstein gestures at the graph.
“See here, Count. The Internet took a decade to reach 1 billion users. Mobile took about five. But generative AI? It’s measured in months.”
Dracula’s eyes narrow.
“Yes, I read that in the mortal scholars’ scrolls. The Federal Reserve Bank of St. Louis found AI adoption outpacing every major technology in history, even those bloodthirsty smartphones.”
(source)
He taps his screen, revealing another chart.
“And look here, eMarketer reports that generative AI reached 77.8 million users in two years, faster than the rise of smartphones or tablets.”
(source)
The monster grunts. “Even the villagers use it now. They ask it for recipes, resumes, love letters.”
Dracula raises an eyebrow. “And blood type analyses, perhaps?”
They both laugh, the uneasy laughter of men who realize the experiment has escaped the lab.
🧛 The Curse of Exponential Curiosity
Dracula glides to the window, staring out into the storm. “You see, Frankenstein, mortals cannot resist their reflection. Once they taste a new tool that speaks back, they feed it endlessly. Every prompt, every query, every midnight whisper, more data, more growth.”
“Like feeding a beast,” Frankenstein says.
“Exactly,” Dracula grins. “And this one feeds itself. Every interaction strengthens it. Every mistake teaches it. Even their fears become training data.”
He twirls his cape dramatically. “You’ve not created a machine, my dear doctor. You’ve unleashed an immortal.”
⚙️ Why the Curve Keeps Climbing
The monster scribbles four words on the wall: “No friction. Infinite feedback.”
“That’s the secret,” Frankenstein explains. “Unlike the old revolutions, electricity, mobile, internet, AI doesn’t require factories or towers. It scales through code, not concrete. The more people use it, the more valuable it becomes. That’s why the line won’t flatten.”
Dracula nods. “A perfect storm of seduction: zero cost to start, instant gratification, and endless novelty. Even I couldn’t design a better addiction.”
Together, they stare at the graph again.
The AI line doesn’t level off. It bends upward.
The candles flicker. Somewhere, a server farm hums, millions of GPUs glowing like a field of jack-o’-lanterns in the dark.
🦇 The Night Is Still Young
Dracula turns to Frankenstein. “Do you fear what comes next?”
The doctor sighs. “I fear what happens when the curve stops rising and starts replacing.”
Dracula’s grin fades. For a moment, the immortal looks mortal.
“Perhaps,” he says, “but revolutions always come with a price. The villagers feared your monster once, and now they fear their own machines.”
Lightning cracks across the sky.
“But remember, Doctor,” he continues, “progress is a creature that cannot be killed, only guided.”
The monster, now quiet, whispers, “Then let’s hope we are still the ones holding the switch.”
🎃 The Bottom Line
AI’s adoption curve hasn’t flattened because we’re still discovering what it is.
It’s not a single invention like the phone or the PC. It’s a living layer that spreads through APIs, integrates into tools, and evolves faster than we can measure.
The mobile revolution connected us.
The AI revolution is re-creating us.
And if the trendlines are right, we’re still only at the first act of this gothic tale. The lab lights are still on. The storm still rages.
And somewhere, in the distance, the curve is still rising.
Further Reading (for those who dare look deeper):